Project Management
Analytics Overview
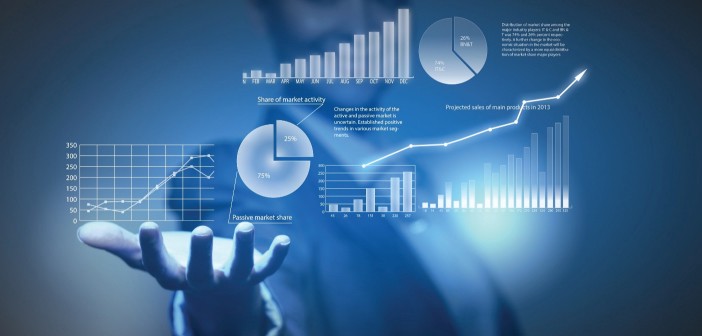
Pushpendra Technology delivers advanced Analytics Overview solutions designed to empower businesses with accurate, real-time insights for smarter decision-making and sustainable growth. Our analytics systems transform raw business data into meaningful visual reports, actionable intelligence, and performance-driven strategies that help organizations monitor, evaluate, and optimize every aspect of their operations.
Our intelligent analytics platforms provide a centralized dashboard for tracking key performance indicators, operational metrics, customer behavior, financial performance, workflow efficiency, and project progress in real time. With interactive dashboards, automated reporting, and data visualization tools, businesses gain complete visibility into their performance landscape.
We enable organizations to identify trends, measure productivity, analyze operational bottlenecks, and discover opportunities for process improvement through comprehensive data analysis. Our solutions are built to simplify complex datasets into understandable charts, graphs, and reports that support strategic planning and informed business decisions.
Pushpendra Technology’s Analytics Overview systems are designed with scalability, accuracy, and flexibility in mind, allowing businesses of all sizes to access custom reports tailored to their unique goals. From tracking sales performance and customer engagement to evaluating resource utilization and operational efficiency, our platform ensures complete control over business intelligence.
With predictive analytics, automated alerts, real-time monitoring, and performance forecasting, our solutions help organizations proactively respond to challenges, reduce risks, and improve outcomes. By combining innovation with intelligent data processing, we help businesses unlock the full potential of their information and drive measurable success through data-driven transformation.
Key Features
- Real-Time Dashboard – Monitor live performance metrics.
Data Visualization – Interactive charts and graphs.
Performance Tracking – Measure project or business growth.
- Custom Reports – Generate reports based on requirements.
User Activity Monitoring – Track user behavior and engagement.
Traffic Analysis – Analyze website/app visitors.
- Conversion Tracking – Measure leads and sales performance.
Revenue Insights – Track financial growth.
Trend Analysis – Identify patterns over time.
 Slack
Slack Drive
Drive Dropbox
 Notion
 Mailchimp
 Discord
 Github
 Open AI
 Name Cheap

